Build your web application completely in Excel or Google Sheets. Here's how it works!
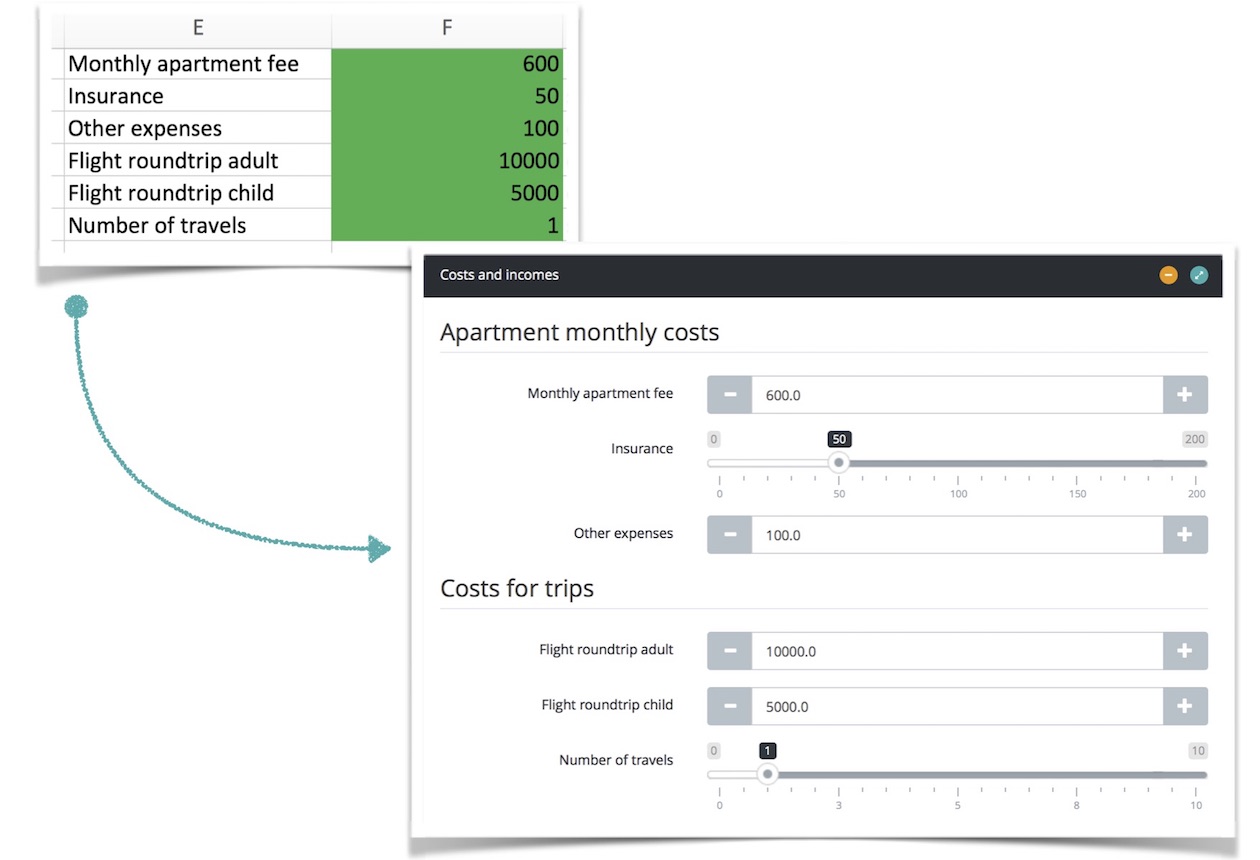
Inputs
Inputs are elements in your application with which the user can interact. They can be text fields, sliders, menus, buttons and much more.
-
Color Them Green
Color your input cells green to turn them into input elements in your Molnify application.
-
Customization
You can easily specify specific options for each input element if you want to customize its appearance.
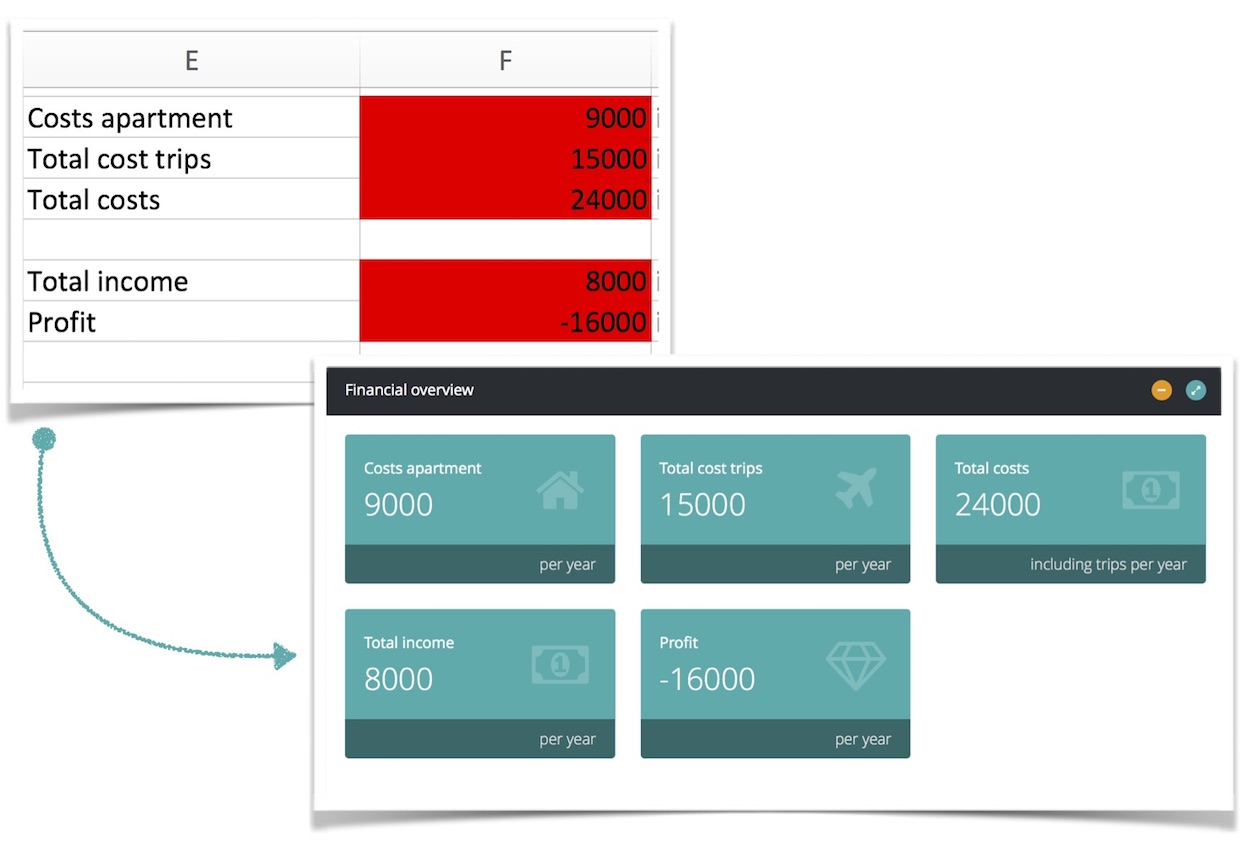
Output Boxes
Output boxes are great for displaying results. They can contain logic and formulas, such as =C4*C5, =VLOOKUP(...), =SUM(...) and many more. This lets you construct applications just the way you're used to in Excel or Google Sheets.
-
Color Them Red
Color your output cells red to render them as informative output boxes.
-
Customization
Comments to the output cells will be displayed as descriptions below the output boxes. You can customize further by, e.g., adding a descriptive FontAwesome icon.
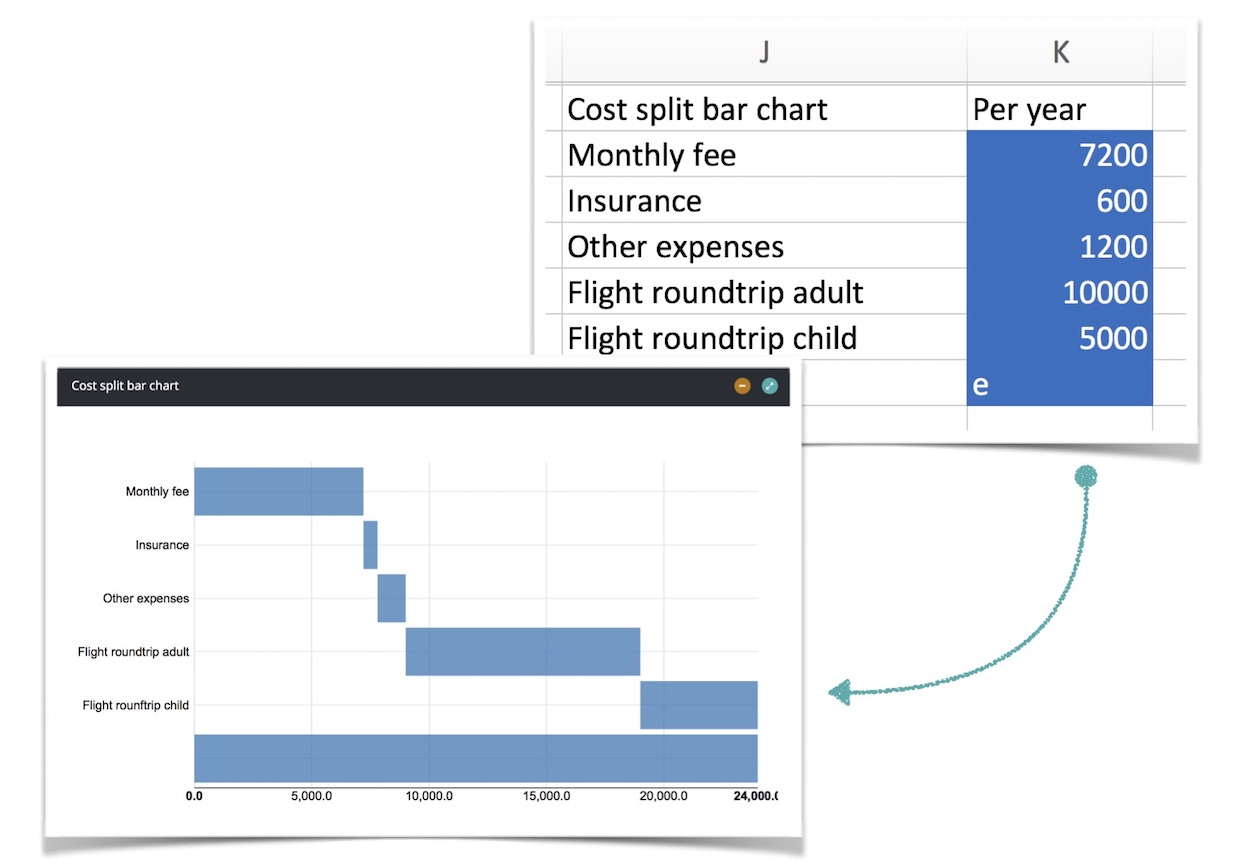
Charts
Add a chart to visualize your data.
-
Color Them Blue
Color a group of cells blue to present them as a chart.
-
Available Charts
Molnify supports a range of charts, including bar, line, pie and waterfall charts. Molnify automatically determines chart type and the best representation of your data.